
BRIEF –
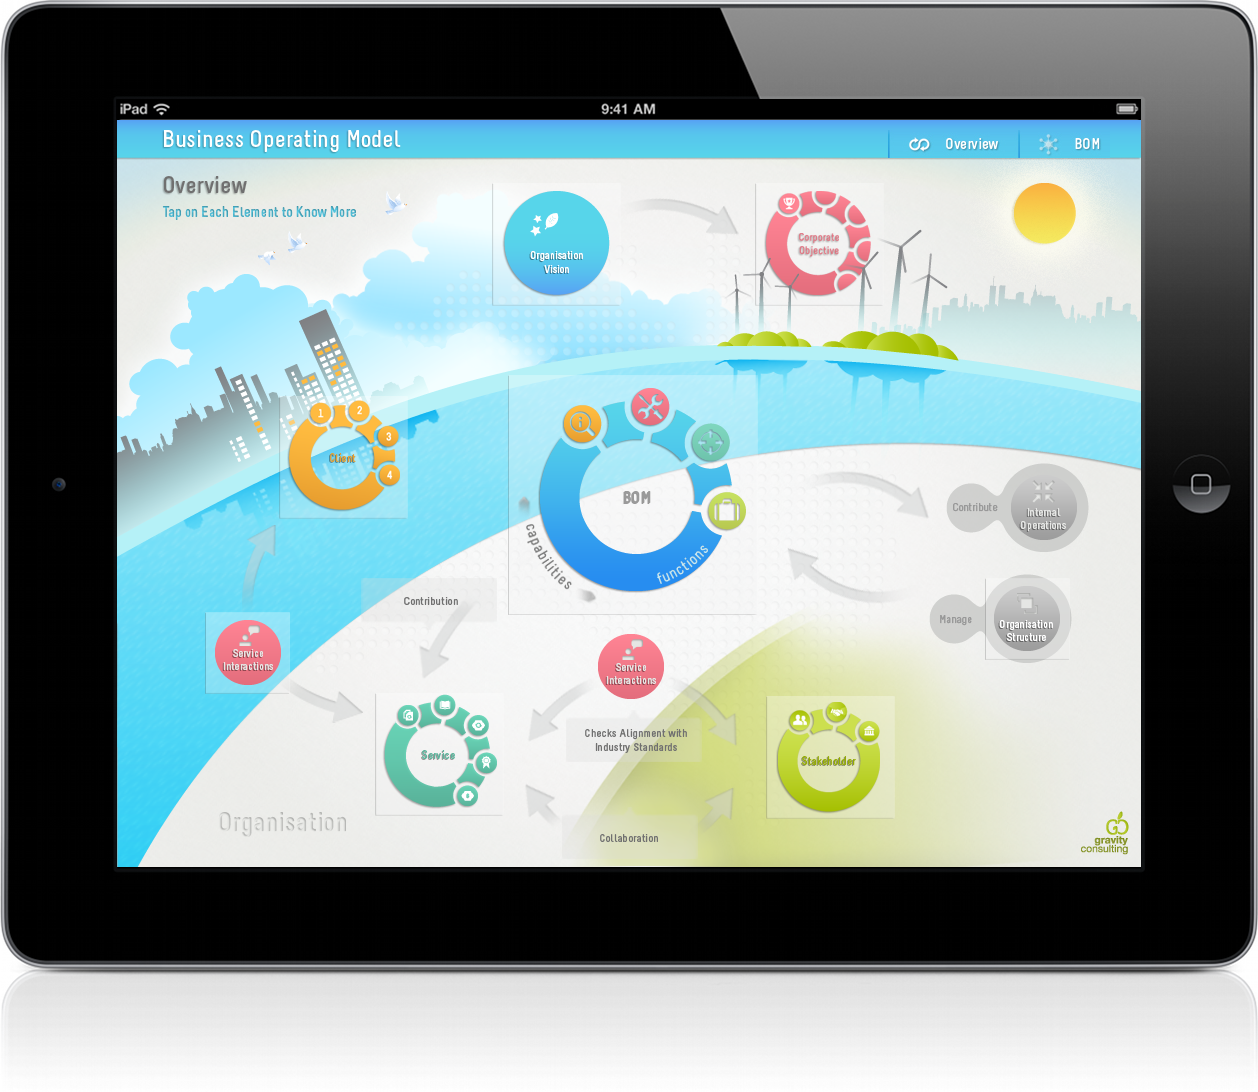
Performance metrics, goals & organization structures are just plain data when depicted in paper and texts. We gave our client IPA –
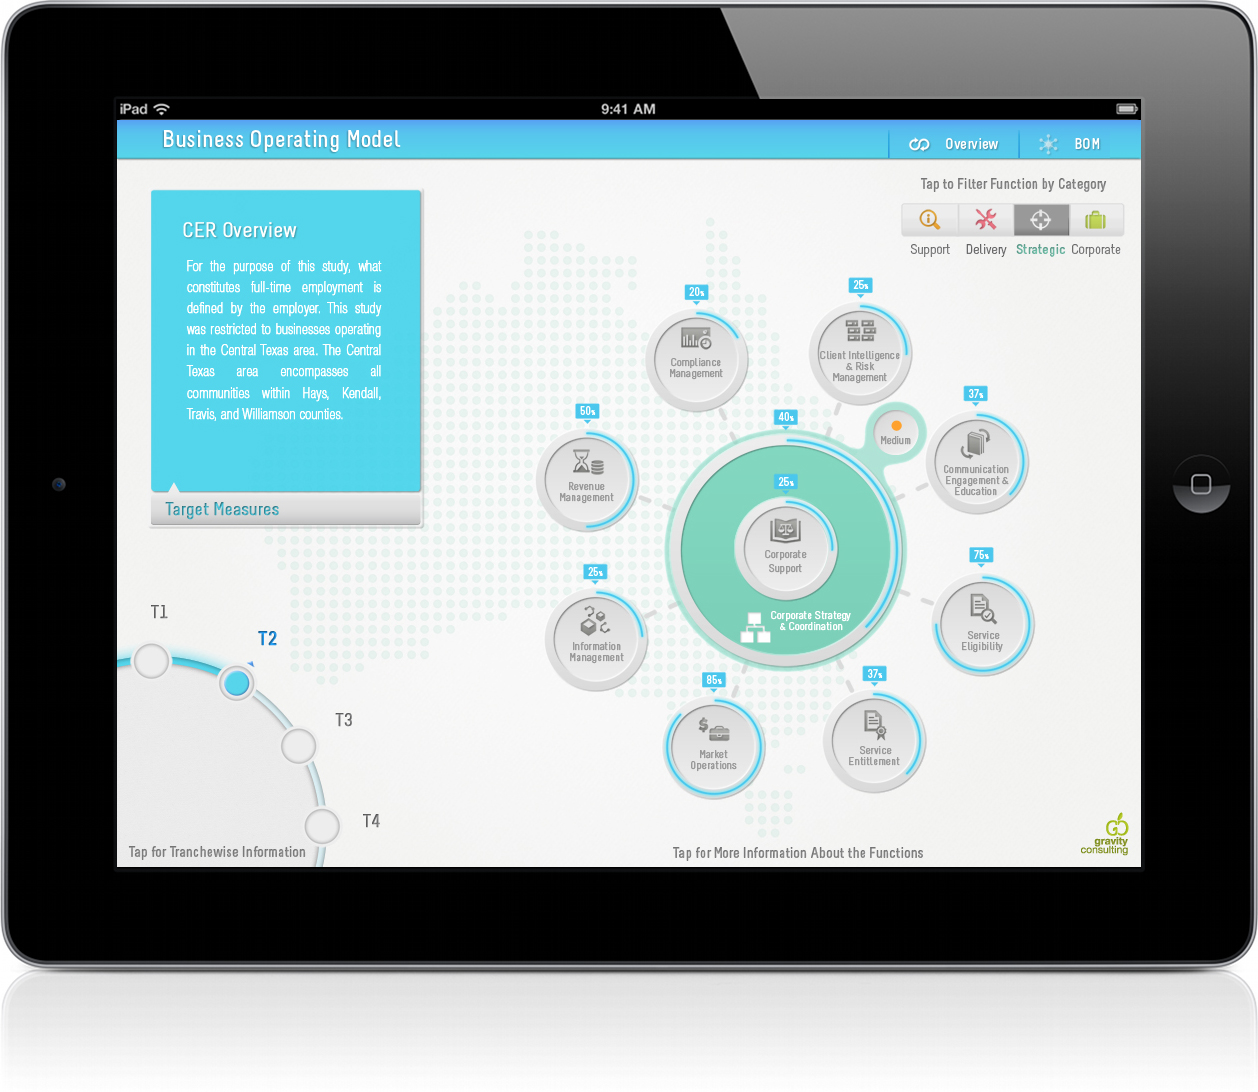
Australian Government, a complete makeover of their data through simply mapped visuals of its constituent components and created several interactive visualizations for them.
IPA’s HR department envisioned to create an integrated platform for all their daily operation needs.
CHALLENGES –
Depict performances, goals ,and organizational changes for easy understanding.
STRATEGY –
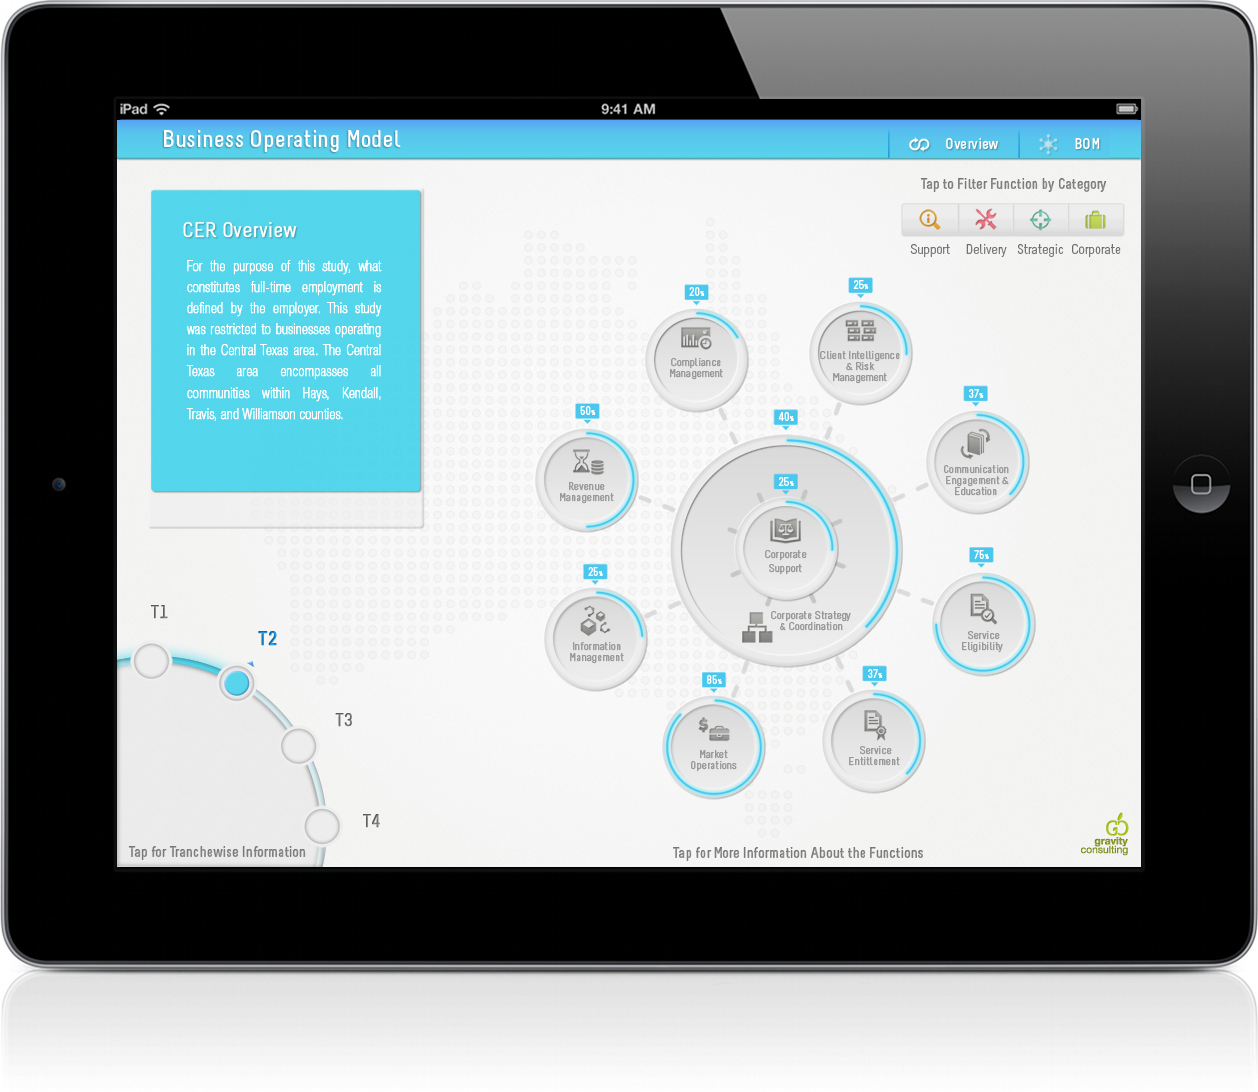
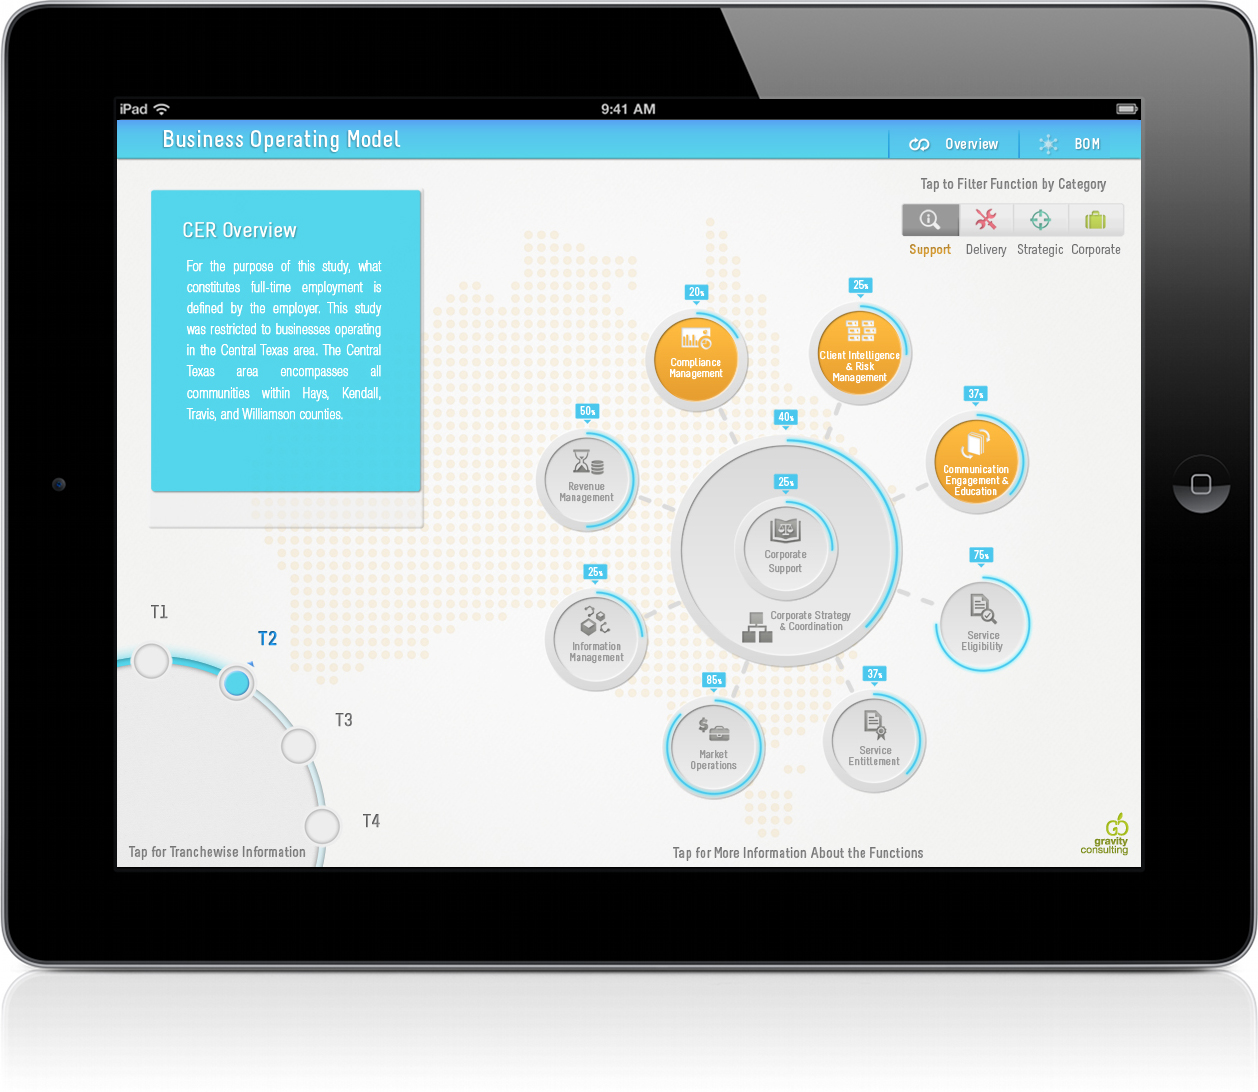
We studied their existing operations and processes – developing automated processes for the HR department and designing intuitive widget dashboard. The dashboard helps to assess resources, access information and efficiently perform.
IMPACT –
- Unique communication tools for Mobility of complex and big data.
- Easy identification of bottle necks.
- Differentiation of service offering.